Solution 7.0

07. Reform Governance and Funding

The Capital Region consists of three major funding jurisdictions, along with dozens of public and private transportation operators. The region cannot achieve an optimized transportation system without tackling the core issues around how the transportation system is governed and funded.

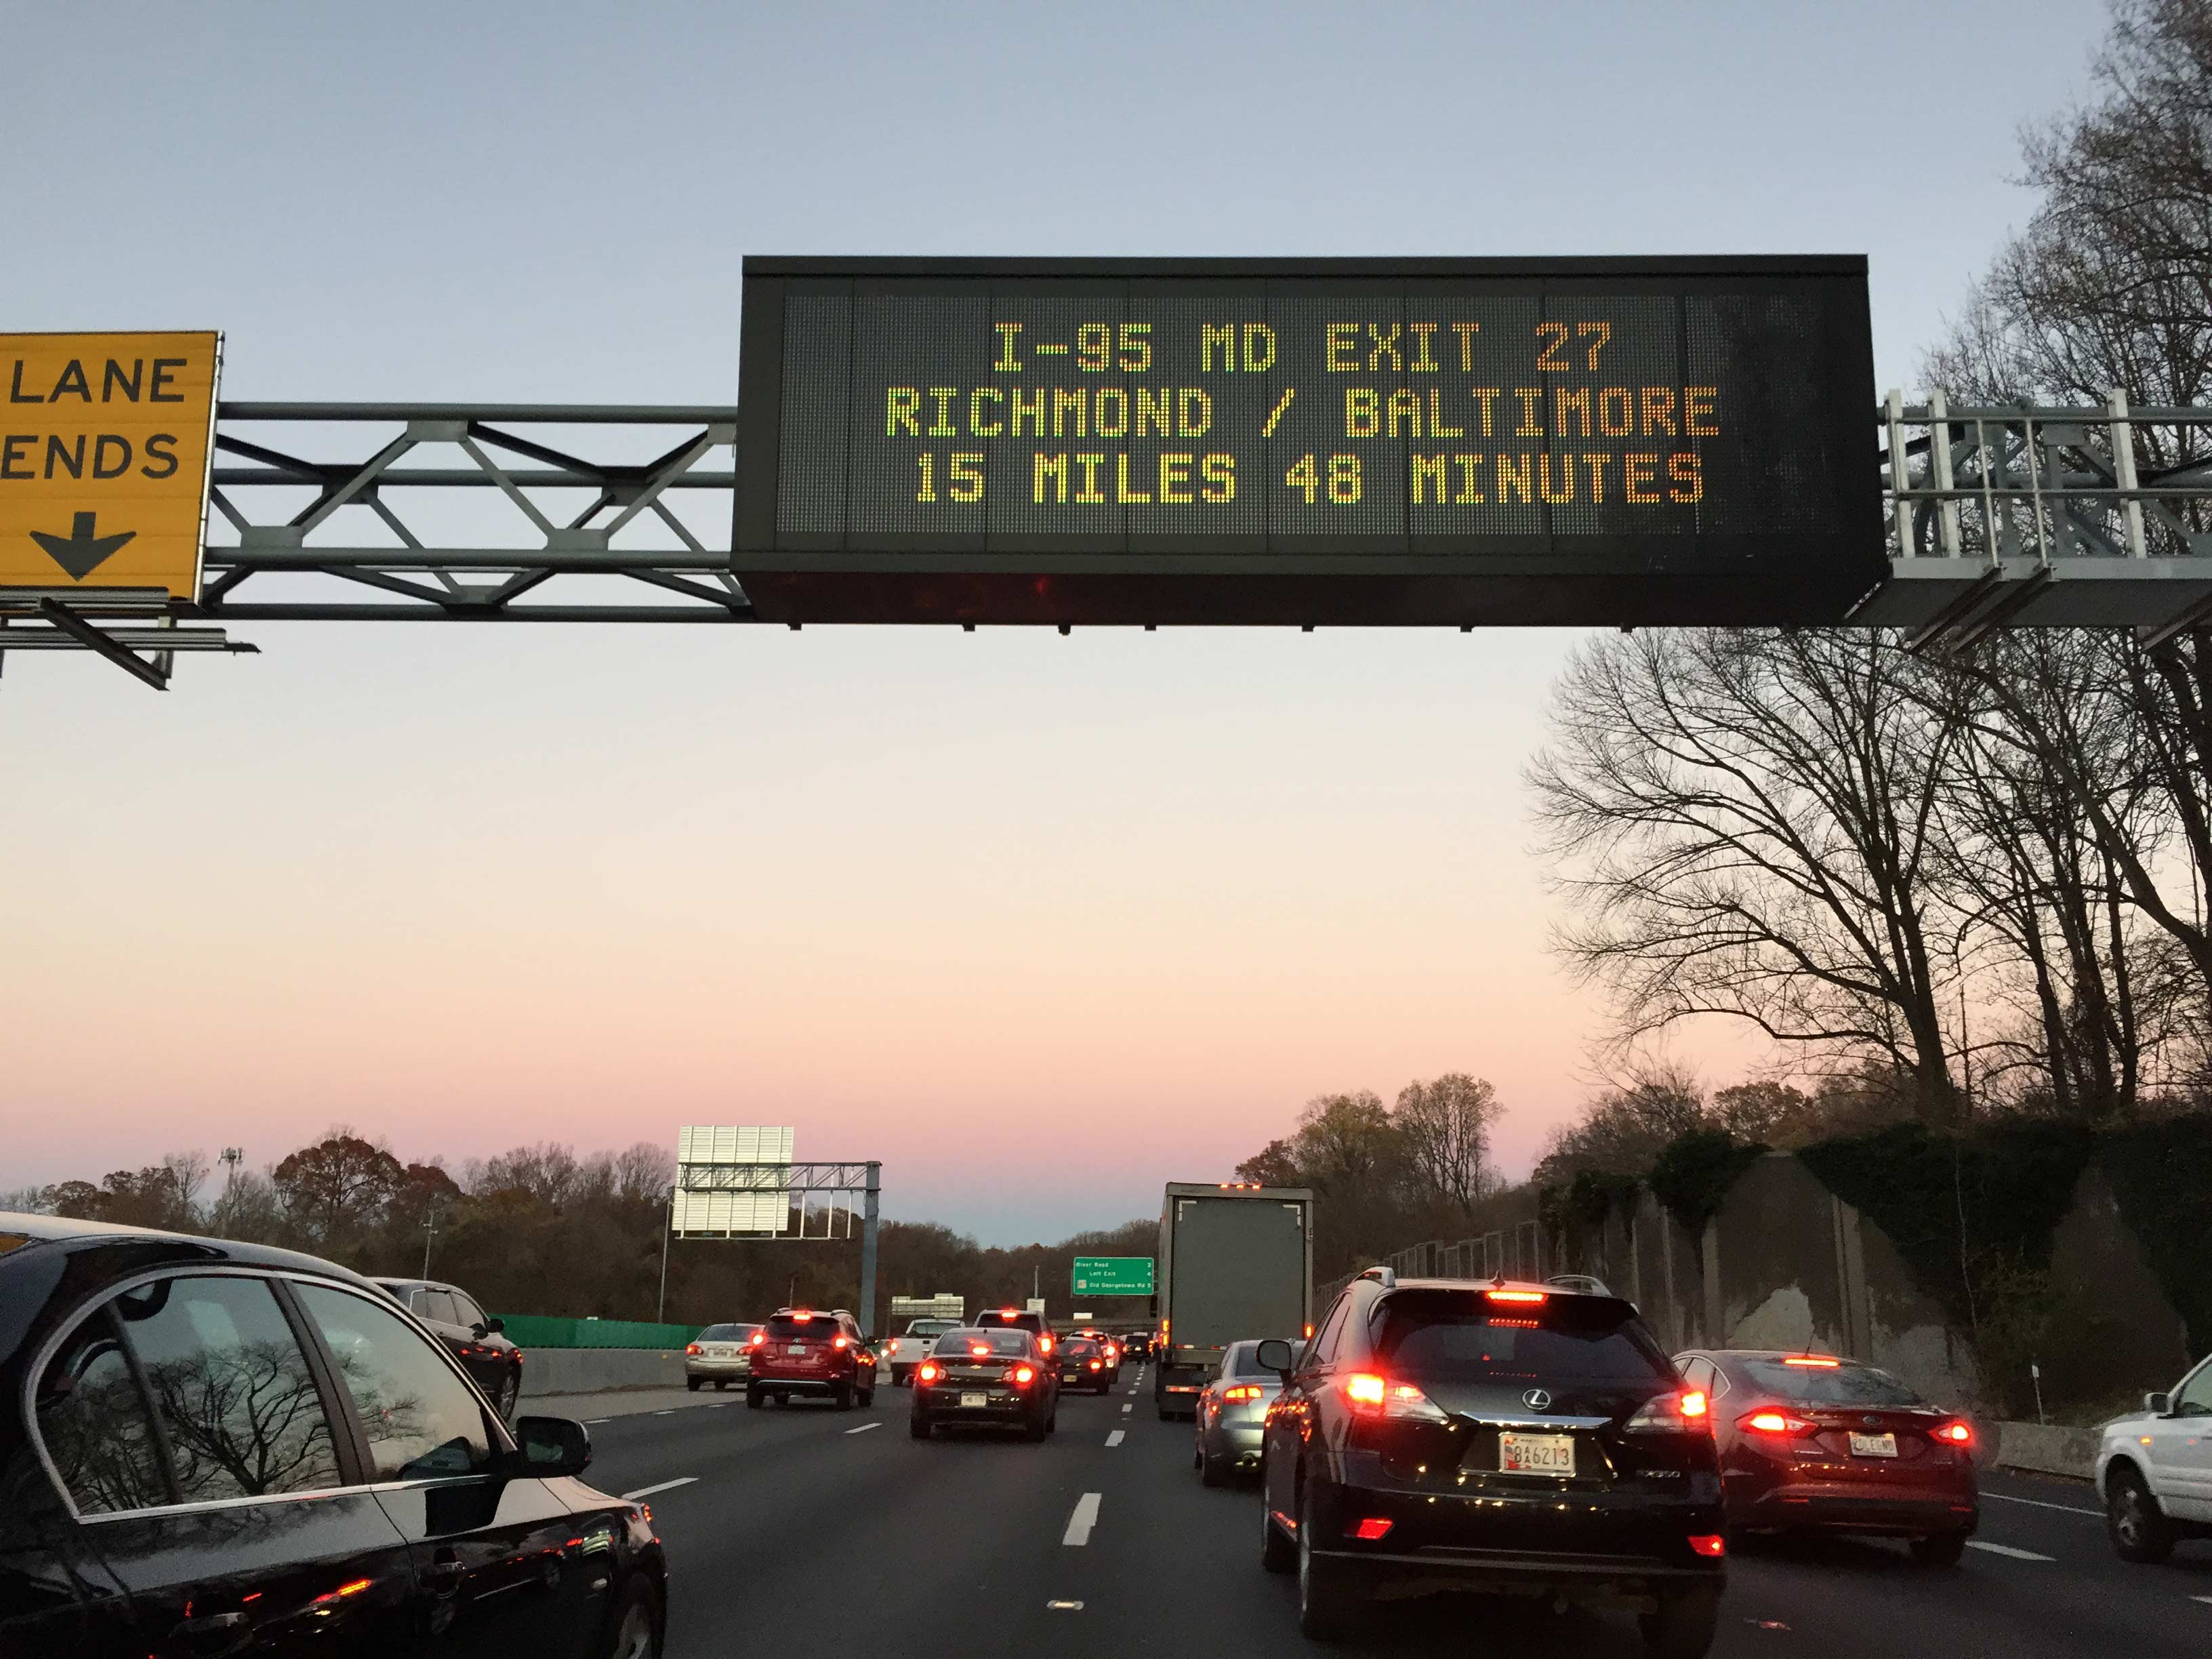
Under current projections, roadway congestion will worsen across the Capital Region through 2040—increasing by more than 150 percent from 2015 levels.1 In other words, by 2040 the region’s consumers will go from sitting in congestion 30 percent of each trip to nearly 50 percent.2 With nearly 50 percent of the region’s residents crossing county borders and 20 percent crossing state lines to access their job sites,3 the region’s governing entities must be able to both plan for and invest in the region’s transportation system to match the region’s growth.

To change the current trajectory, each Capital Region jurisdiction should actively engage in reforming the way the region governs and pays for transportation.

Capital Region Performance

The region’s institutions and transportation investments must be examined to ensure they are making the best use of each transportation dollar. Businesses justify their spending to shareholders by clearly outlining the data-driven expected benefit, rate of return, or strategic imperative for each investment, and measuring if these outcomes are achieved over time. This level of transparent, objective decision making and accountability should be expected for the multibillion-dollar annual transportation investments in capital and operating budgets from the region’s transportation agencies.

Yet, often, it is unclear how transportation investments achieve stated goals or outcomes for the transportation system or for the region. Transportation agencies and metropolitan planning organizations (MPOs) often present projects to the public without comparing one investment against others—leaving the decision making process for transportation investments a mystery to both the general public and many professionals in the transportation community. This is often due to the fact that politics sometimes overrides smart, data-driven analysis for transportation decision making. The result can be transportation investment decisions that siphon resources away from more worthy initiatives and, ultimately fail to address the region’s needs.

Unfortunately, consumer access to opportunity is not typically used as a key input in determining and evaluating transportation investments and performance. In the Capital Region, access to opportunity varies widely based on an individual’s income and race, and that inequity only holds back our region’s growth. The Partnership encourages the Capital Region’s transportation agencies to incorporate a common definition of equitable access, and proposes the use of the following:

We define equitable access as every resident of the Capital Region—regardless of the person’s community, race, ability, or background—having consistent, safe, affordable, and dependable physical access to quality employment with living wages and benefits, education, and necessities that enable economic mobility and opportunity.

In adopting this definition, Maryland, Virginia, and the District—alongside their MPOs, transit agencies, and local governments—should move beyond mitigating negative impacts to low-income and majority-minority communities from transportation decisions. The region can overcome this challenge by intentionally making equitable access a key factor in its performance-based plans and investments to measurably improve access in communities with lower levels of mobility.

In particular, Baltimore’s public transportation system’s governance and funding structure must be adjusted to improve accountability from all parties. The metro area’s public transportation system is one of just a few in the country that is governed and operated by a state agency rather than a regional authority or local transportation department. Funding for public transportation in Baltimore reflects this governance structure: The primary source of funding for Maryland Transit Administration (MTA) capital and operating expenses is the state Transportation Trust Fund. The city and counties do not contribute to MTA’s services. Under this structure, Baltimore’s public transportation system has not kept pace with repair and service needs or developed a strategy to enhance existing service. This governance and funding structure must be reformed to enhance accountability from all vested stakeholders and shared investments to create a globally competitive rapid and reliable transit system in the Baltimore metro area.

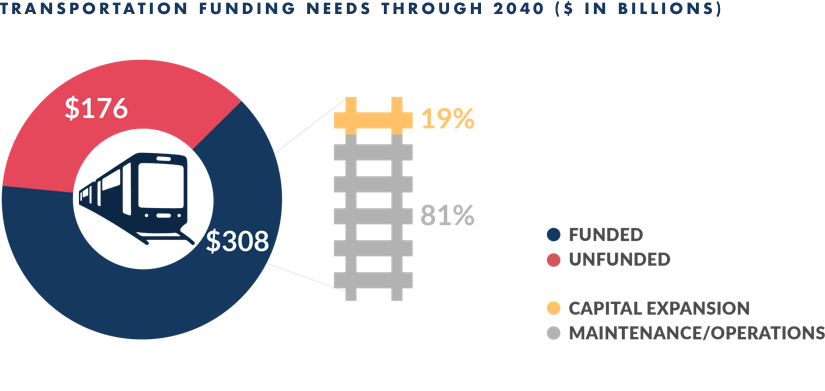
While our region can do much more with current resources, additional funding will be needed to fully transform the region’s mobility outcomes. Although Maryland, the District, and Virginia have each passed transportation funding bills since 2013 that are projected to increase transportation revenues by more $7 billion by 2019, the Capital Region lacks $176 billion needed to address identified capital, operations, and maintenance improvements through 2040 (approximately 36 percent above expected funding levels).4

Strengthening federal resources in Capital Region transportation projects will help close this funding gap by speeding up delivery of critical transportation investments and will also benefit both our local communities and our national economy. Federal support for the Virginia Atlantic Gateway multimodal I-95 corridor congestion relief program is projected to provide nearly $3.5 billion in economic benefits—leveraging federal, state, and private investments more than 3:1—and improve the highway and rail corridors that move over 350 million tons of freight each year and more than 400,000 people a day.5

To speed up these types of investments, the United States Congress must increase federal funding—starting with the first federal gas tax increase in a quarter century. Taxes on gasoline serve as the primary source of funding for transportation investments at all levels of government. Yet gas tax revenues are not keeping pace with current or projected transportation funding needs. The federal gas tax remains stuck at 1993 levels, which has eroded its purchasing power by more than 40 percent over the past quarter century.6 With inflation and rising costs, Congress must pull from elsewhere in the federal budget to mask the shortfalls in the nation’s transportation fund—just to maintain status-quo funding levels.

In addition, the region can be more effective in partnering to increase our rate of return from existing competitive grant programs to fund critical investments. As the number of low- or no-gas vehicles on the road increases, the resulting decrease in gas tax revenues is expected to grow the Capital Region’s transportation funding gap an additional $42 billion by 2040—to more than $200 billion.7 As a result, the region needs to begin planning for the future and begin to identify viable alternatives to gasoline taxes. The region can begin piloting innovative funding sources now in Maryland, Virginia, and the District, in partnership with the U.S. government.

Actions

Citations:

  1. UMD analysis of the Chesapeake Bay Megaregion Model.
  2. Ibid.
  3. Each day, 49 percent of all commuters—2.4 million people—in the Capital Region cross county lines to get to their place of work. Seventeen percent of the region’s commuters travel across state borders to access jobs. Partnership analysis of U.S. Census American Community Survey.
  4. Partnership analysis of the 2040 long-range transportation plans for the BRTB, TPB, FAMPO and RRTPO.
  5. Atlantic Gateway: Partnering to Unlock the I-95 Corridor. VDOT and DRPT FASTLANE Grant Application prepared for USDOT, April 14, 2016. http://www.virginiadot.org/projects/resources/atlantic_gateway/Atlantic_Gateway_FASTLANEGrantApp2016.pdf.
  6. “More Stop-and-Go Financing of Highway Trust Fund.” Peter G. Peterson Foundation, May 2015. https://www.pgpf.org/budget-basics/more-stop-and-go-financing-of-highway-trust-fund
  7. Partnership analysis of Federal Highway Administration Traffic Volume Trends and Motor Fuel and Highway Trust Fund, and U.S. Energy and Information Administration Annual Energy Outlook and U.S. Total Gasoline Wholesale/Resale Price by Refiners.
  8. “Metro gets third and final ‘yes’ as Maryland commits to its full share of dedicated funding.” The Washington Post, March 22, 2018. https://www.washingtonpost.com/local/trafficandcommuting/metro-gets-3rd-and-final-yes-as-maryland-commits-to-its-full-share-of-dedicated-funding/2018/03/22/ecd63946-2dfa-11e8-8ad6-fbc50284fce8_story.html?utm_term=.b5e4ca1dedcf
  9. “Washington Metropolitan Area Transit Authority: Assessing Fiscal Risks and Improving Workforce Management Would Help Achieve Strategic Goals.” United States Government Accountability Office Report to Congressional Requesters, September 2018. https://www.gao.gov/assets/700/694418.pdf
  10. “Washington Metropolitan Area Transit Authority: 2017 Annual Agency Profile.” National Transit Database, 2017. https://www.transit.dot.gov/sites/fta.dot.gov/files/transit_agency_profile_doc/2017/30030.pdf
  11. “Public Hearing on Bill 22-568, the Washington Metropolitan Area Transit Authority Dedicated Funding Act of 2017.” Testimony of Jeffrey S. DeWitt, CFO, Government of the District of Columbia, February 7, 2018. https://cfo.dc.gov/sites/default/files/dc/sites/ocfo/release_content/attachments/DeWitt%20Testimony%20-%20WMATA%20020718.pdf
Expand to learn moreCollapse

Action 7.1

Measure and report the outcomes and equity benefits of each capital transportation investment

What

Often it is unclear how transportation investments achieve stated goals or outcomes for the region’s transportation system. Changing this will require the region to measure not just the state of the transportation system, but how transportation investments impact people’s lives. Transportation agencies can use performance measures to evaluate the outcomes a transportation investment will achieve. By using this performance-driven approach, agencies can better direct limited resources to transportation investments that best address the region’s needs, ensure politics do not decide which transportation projects receive funding, and increase transparency with the public.

Today, many residents in the Capital Region live without access to essential transportation options—limiting their upward economic mobility and holding back the region’s full potential. To provide better economic and social mobility, the region should incorporate equitable access metrics into plans, investment programs, and projects, with the goal of overcoming historic inequities derived from the region’s transportation network. As outlined in other sections of this Blueprint, the Partnership encourages the Capital Region’s transportation agencies to incorporate a common definition of equitable access, and proposes the use of the following:

We define equitable access as every resident of the Capital Region — regardless of the person’s community, race, ability, or background — having consistent, safe, affordable, and dependable physical access to quality employment with living wages and benefits, education, and necessities that enable economic mobility and opportunity.

If the region embraces a performance-driven approach to its planning and investments, it will improve residents’ access to opportunity and ensure the region invests its scarce resources in projects that deliver results in line with the region’s goals for the transportation system.

Why

Businesses justify their spending to shareholders by clearly outlining the data-driven expected benefit, rate of return, or strategic imperative for each investment—and measuring if these outcomes are achieved over time. This level of transparent, objective decision making and accountability should be expected for the multibillion-dollar annual transportation investments in capital and operating budgets from the region’s transportation agencies.

Yet, often, it is unclear how transportation investments achieve stated goals or outcomes for the transportation system or for the region. Transportation agencies and metropolitan planning organizations (MPOs) often present projects to the public without comparing one investment against others—leaving the decision making process for transportation investments a mystery to both the general public and many professionals in the transportation community. This is often due to the fact that politics sometimes overrides smart, data-driven analysis for transportation decision making. The result can be transportation investment decisions that siphon resources away from more worthy initiatives and, ultimately, fail to address the region’s needs.

In 2015 Virginia established its Smart Scale project scoring system, which aimed to reduce the influence of politics on decisions by using performance metrics to prioritize investments in the “right transportation projects.”1 This nationally leading policy has received widespread recognition. The measures include access to jobs, access to jobs for disadvantaged people, and access to multimodal choices, among other key factors. All capital projects for the state are scored and ranked using the system, which has completed two funding rounds and provided funding for more than 300 projects statewide.2

After a statute was enacted in April 2017, the Maryland Department of Transportation (MDOT) is conducting its first round of evaluating projects for funding and inclusion in the state’s annual transportation investment program using a new project-based scoring system to evaluate all highway and transit capacity projects exceeding $5 million.3 Equitable access is one of nine criteria for the scoring model and measures each project for how it will impact job accessibility and economic development for disadvantaged or low-income populations.4 MDOT will also score projects more favorably if they enhance the safety, attractiveness, and accessibility of existing communities for transit riders, cyclists, and pedestrians.5 Currently, funding decisions for the Maryland Transit Administration (MTA) are made using an obscure process at the state level.

The District, Baltimore Metropolitan Council (BMC), and the Richmond Regional Transportation Planning Organization (RRTPO) do not have a project scoring process for both planning and investment programs. The Washington metro area has placed a significant level of trust in Washington Metropolitan Area Transit Authority (WMATA) to deliver maximum benefit from the historic agreement in 2018 to dedicate $500 million in additional funding for the system.6 However, the agency does not have an outcome-focused decision making process. WMATA’s 2017 10-year strategic plan prioritizes projects based on a limited set of criteria.7 This plan serves as a broad list of transportation needs and not a list of funding decisions; project costs are not factored into the prioritization process.

As outlined in other sections of this Blueprint, consumer access to opportunity in the Capital Region varies widely based on the consumer’s transportation mode, income, and race. The average Capital Region resident can access more than 1,320,000 jobs by vehicle, 109,000 jobs by transit, 203,000 jobs by bicycle, and 25,000 jobs by walking within 45 minutes from their home.8 Within this frame, transit provides access to 11 percent of the total number of jobs available by vehicle region-wide.9 Black residents in the Capital Region are almost three times as likely as white residents to live in areas with poor transit access to jobs as well as low vehicle ownership rates.10 Households in poverty are nearly two-and-a-half times more likely to live in areas with poor transit access to jobs and low vehicle ownership rates.11

Maryland, Virginia, and the District—alongside their MPOs, transit agencies, and local governments—should move beyond mitigating negative impacts to low-income and majority-minority communities from transportation decisions, and take steps to incentivize plans and investments that will measurably improve communities with lower levels of mobility and access.

Benefits

Virginia’s Smart Scale system is already allowing the state to stretch limited transportation dollars further and make measured progress toward key issue areas. With unfunded transportation needs expected to rise, adopting similar objective scoring systems in Maryland and the District could help lessen negative impacts.

In the near term, improving equitable access will increase the workforce that can reach available jobs. Over time, the region would realize the inclusive benefit to the local labor market from greater participation in the economy by all residents, as well as improved access to education, healthcare, and key activity centers.

Barriers

The Capital Region must take an honest look at its transportation investments and the extent to which they are achieving the region’s stated goals, including their impact on equitable access. Politics often derail rational transportation decisions at all levels of government in this region and throughout the country. The Capital Region’s transportation agencies should acknowledge this and incorporate sound business practices to ensure each dollar achieves stated goals and expected outcomes.

Next moves

The Capital Region’s jurisdictions and transportation agencies should establish clear, transparent measures and metrics to guide transportation plans and investments, and take a coordinated approach to incorporating equitable access into transportation decisions to intentionally overcome historic transportation inequities for select communities in the region.

Next moves are:

  • The DC government, the RRTPO, and the BMC should establish a transparent performance-driven project scoring program to prioritize plans and make transportation investments
  • MDOT should publicly review of its performance-driven project scoring program (Chapter 30) after its first funding cycle to ensure it delivers the intended outcome
  • WMATA should develop a transparent performance-driven project selection program that focuses on regional benefit and removes politics from significant funding decisions
  • MDOT, District Department of Transportation (DDOT), Virginia Department of Transportation (VDOT), the MPOs, and transit agencies should establish regionally aligned performance criteria incorporating equitable access as a primary performance measure for plans, investments, and project development

Costs

Federal regulations require states and MPOs to measure the performance of their transportation investments using measures such as safety, congestion, state of good repair, and connectivity.12 The benefits from more effectively using limited transportation dollars would outweigh the costs of creating a transparent project scoring system at every level of government in the Capital Region. In Virginia, the cost to develop the Smart Scale prioritization process is estimated at $1.4 million, with $770,000 in staff and consultant costs and $800,000 for technical services associated with the web-based application portal.13 The annual operating costs for the Smart Scale process are estimated to be $800,000, which includes staff time, consultant support, and technical maintenance costs.14

Citations:

  1. “Aubrey Layne column: Virginia’s roads and bridges being built on a better foundation.” Richmond Times-Dispatch. March 18, 2017. https://www.richmond.com/opinion/their-opinion/guest-columnists/aubrey-layne-column-virginia-s-roads-and-bridges-being-built/article_a7082637-0b78-5792-8581-6da24eb47815.html.
  2. “Smart Scale: Projects.” VDOT, 2018. http://vasmartscale.org/projects/default.asp
  3. The statute excludes all projects that are solely for system preservation.
  4. “Chapter 30 Transportation Project-Based Scoring Model: 2018 Technical Guide.” Maryland DOT, 2018. http://www.mdot.maryland.gov/newMDOT/Planning/Chapter_30_Score/Images_and_Documents/MDOT_TechnicalGuide_Final_12292017.pdf
  5. Ibid.
  6. “Metro gets third and final ‘yes’ as Maryland commits to its full share of dedicated funding.” The Washington Post, March 22, 2018. https://www.washingtonpost.com/local/trafficandcommuting/metro-gets-3rd-and-final-yes-as-maryland-commits-to-its-full-share-of-dedicated-funding/2018/03/22/ecd63946-2dfa-11e8-8ad6-fbc50284fce8_story.html?utm_term=.b5e4ca1dedcf
  7. The four criteria include asset condition, safety and security, service delivery, and ridership impact. 10-Year Capital Needs Inventory and Prioritization: CY 2017-2026 Needs. WMATA Office of Planning, November 2016. https://www.wmata.com/initiatives/plans/upload/CNI-full-report-and-appendices.pdf.
  8. Greater Washington Partnership data analysis generated using Citilabs Sugar Dataset, which includes 2007-2011 ACS Data, 2012-2016 ACS Data, 2015 Longitudinal Employer-Household Dynamics Data, and Citilabs transportation networks.
  9. Ibid.
  10. Ibid.
  11. Ibid.
  12. The Moving Ahead for Progress in the 21st Century (MAP-21) legislation passed by Congress in 2012 created performance measure requirements under the federal transportation program.
  13. Email communication between Virginia DOT and Maryland DOT in May 2017. Virginia DOT provided to the Partnership in September 2018.
  14. Ibid.
Expand to learn more Collapse

Action 7.2

Create a new regional governance structure for Baltimore public transportation

What

Baltimore’s public transportation system is one of just a few in the country that is governed and operated by a state agency rather than a regional authority or local transportation department. Funding for public transportation in Baltimore reflects the following governance structure. The primary source of funding for the Maryland Transit Administration (MTA) capital and operating expenses is the state Transportation Trust Fund. The city and counties do not contribute to MTA’s services, although they do provide funding for other local bus services (e.g., the city of Baltimore pays for the Charm City Circulator).

Under this structure, Baltimore’s public transportation system has not kept pace with repair and service needs or developed a strategy to enhance existing service. This governance and funding structure must be reformed to enhance accountability and shared investments to create a truly regional rapid and reliable transit system in the Baltimore metro area.

Why

Among large cities, the most common governance structure for public transportation is a regional authority overseen by a board of directors. In contrast, the MTA is part of the executive branch of the state and reports to the governor—with no local oversight. The governor’s priorities can differ from those of the region and years of planning and investment by prior administrations. State officials are accountable to constituents across Maryland, many of whom do not live in Baltimore and may not share Baltimore’s goals. At the same time, local officials in the Baltimore area, who are accountable to Baltimore-area residents, have no direct role in the area’s public transportation.

The creation of the Central Maryland Regional Transit Plan Commission as part of the Maryland Metro/Transit Funding Act of 2018 is a step in the right direction. The Commission will help MTA prepare a Central Maryland Regional Transit Plan by October 1, 2020.1 The Plan will define goals for Baltimore-area public transportation and identify options for meeting those goals with a combination of existing and new public transportation assets.2 While a visionary plan that focuses specifically on the needs of the Baltimore metro area is sorely needed, implementing that plan will require leadership that is just as regionally focused and regionally accountable.

Benefits

Greater accountability for the performance of Baltimore’s public transportation system is expected to improve outcomes for consumers. A more regionally focused decision making process that prioritizes the goals of the Baltimore area will increase consumers’ confidence in the system and encourage greater use of it.

A 2014 study of transit governance by the Eno Center for Transportation and TransitCenter found that regional priorities are best advanced when there is regional representation in decision making.3 The research showed that states should have a stake in regional transit decisions, but note that too much control and too little accountability from local leaders can lead states to make decisions that are not in line with regional priorities.4 While Baltimore’s transit system was not reviewed in the report, the researchers analyzed Boston’s, which is also run by a state agency. In this case, the study found that, while the state has a strong self-interest in the economic success of the Boston metro area (which includes its capital and largest city), the transit system’s governance structure would be improved by increasing representation from riders and residents in the region.5

Barriers

Changing the current governance and funding structures for public transportation in the Baltimore metro area will require legislative action—potentially at both the state and local levels. Strong, bipartisan political leadership, focused on delivering better outcomes for consumers, will be needed to enact such legislation. Moreover, should a new regional entity be created, care must be taken to structure it in a way that avoids or mitigates common problems with such entities, such as city-suburb tensions.

Next moves

The Maryland General Assembly, in coordination with the governor, should create a new governance structure for the Baltimore metro area transit system that more equitably distributes governing responsibilities and shared funding contributions between the state and local governments in the Baltimore metro area. The new structure should insulate Baltimore’s public transportation decision making process from election cycles to ensure plans and projects can be delivered as promised to the public.

Next moves are:

  • With support from the governor, state and local elected officials, and stakeholders, the General Assembly should establish a blue-ribbon panel to recommend reforms to MTA’s governance and funding structure
  • The blue-ribbon panel should make recommendations to the General Assembly within 16 months regarding key issues and necessary next steps, including:
    • Examples from peer regions of successful structures for shared public transportation funding and oversight;
    • Recommendations for a more effective distribution of responsibilities for public transportation planning, oversight, operations, and funding among state and local governments to achieve a high-performing public transportation system in the Baltimore metro area;
    • Whether a new regional entity should be created or existing entities should be given new responsibilities;
    • If a new regional entity is created, how its members should be appointed;
    • Potential local or regional funding sources for public transportation, including opportunities for local governments to incentivize transit-oriented development (TOD)—development patterns near rapid transit stops that induce greater ridership and increase tax revenues—as part of their funding contribution; and
    • Additional steps needed to improve coordination among all public transportation services in the region

Costs

Creation of a blue-ribbon panel would have modest administrative costs, as would a new governing or oversight body. While some funding responsibilities may eventually shift from the state to the local governments, there should be no changes in the cost of providing public transportation service that directly results from the change in governance.

Citations:

  1. Fiscal and Policy Note. House Bill 372. Maryland General Assembly Department of Legislative Services, 2018 Session. http://mgaleg.maryland.gov/2018RS/fnotes/bil_0002/hb0372.pdf
  2. Ibid.
  3. “Getting to the Route of It: The Role of Governance in Regional Transit,” Eno Center for Transportation and TransitCenter, 2014. https://www.enotrans.org/wp-content/uploads/Transit-Governance.pdf?x43122.
  4. Ibid.
  5. Ibid.
Expand to learn more Collapse

Action 7.3

Increase federal transportation investments to better maintain the existing system and complete critical capital investments

What

The federal transportation trust fund was designed in recognition of the fact that local communities need a strong federal partner to complete the infrastructure projects necessary for regional connectivity and economic growth. However, the primary revenue stream for federal investments—the federal gas tax—remains stuck at 1993 levels, which has eroded its purchasing power by more than 40 percent over the past quarter century.1 With inflation and rising costs, Congress must pull from elsewhere in the federal budget to mask the shortfalls in the nation’s transportation fund—just to maintain status-quo funding levels.

This approach is unsustainable. The resulting investments are not sufficient to sustain the national transportation network at the level the economy needs. Maryland, Virginia, and the District all raised transportation funding in 2013, and the federal government must do the same to fulfill its role as a partner on key regional investments.

Increasing federal transportation user-fees, including the federal gas tax—a move endorsed by a wide array of bipartisan stakeholders across the political spectrum—is needed to ensure the medium- to long-term solvency of the nation’s transportation trust fund. This will also strengthen the direct federal funding support that states and local communities, including the Capital Region, receive each year.2

Source: Long range transportation — Washington D.C, Baltimore, Richmond, and Fredericksburg metropolitan planning organizations.
Note: These totals reflect expenditures and needs planned by metropolitan planning organizations, and may not include projects that are planned and funded entirely by state or local entities.

Why

Despite all three Capital Region jurisdictions recently passing transportation funding bills to support upgrades to the transportation system, current funding cannot meet the system’s needs—and is not sustainable in the long term. Although the funding bills are projected to increase transportation revenues by more than $7 billion by 2019,3 the Capital Region lacks $176 billion needed to address identified capital, operations, and maintenance improvements through 2040 (approximately 36 percent above expected funding levels).4 Because of reduced gas tax revenues, the increasing numbers of electric vehicles and fuel-efficient vehicles are projected to widen this funding gap an additional $42 billion by 2040.5 While transitioning to more fuel-efficient vehicles is an important objective, the reality is that both high- and low-emission vehicles generate maintenance and upkeep expenses and occupy increasingly congested roads and highways.

Like other regions across the country, the Capital Region needs a reinvigorated federal partner to upgrade the transportation systems enabling our nation’s growth and prosperity. The federal gas tax has lost more than 40 percent of its purchasing power since 1993,6 yet the needs and demands of our aging transportation infrastructure are rising. As states and local communities face uncertainty about the future of the federal program and the loss of federal funds, critical projects get delayed or go unfunded. Significant steps should be taken by the U.S. Congress to meaningfully increase federal transportation revenues, such as moving forward bipartisan proposals supported by the U.S. Chamber of Commerce, the national labor movement, and a wide range of stakeholders to increase the current federal gas tax by a quarter per gallon. A stronger federal partner is necessary to fully addressing the nation’s and the region’s transportation needs in the long term.

In addition, the region can more effectively collaborate to increase our rate of return from existing competitive grant programs to fund critical investments. The federal government provides more than $6 billion annually in competitive grants for broad multimodal surface transportation projects, as well as targeted projects for specific modes (e.g., rail, highway) or categories (e.g., mega-regional planning, transit-oriented development planning).7 These transportation programs are competitive and are consistently oversubscribed. The federal grant program now known as BUILD (previously called TIGER) is oversubscribed by 20 times the amount available for disbursement.8 The most successful regions securing federal transportation grants have prioritized their applications to ensure single coordinated and targeted bids are submitted for each grant cycle. This presents a strong partnership and agreement from the submitting region that the grant is warranted and that it will be successful if awarded funds. The Capital Region does not have a federal grant-coordinating strategy—and, in many instances, multiple grants are submitted within the same metro area for the same grant cycle. By working together, our region’s transportation leaders can submit innovative, competitive applications to these federal grant programs and successfully win limited federal transportation dollars.

Concurrently, the Capital Region should explore federal grants to pilot user-based alternative revenue mechanisms to be in position to offset projected declines from gas tax revenues over the next 20 years. One approach is to charge a fee for the amount of driving consumers do—often called a Vehicle Miles Traveled (VMT) fee. This approach uses technology or manual review of vehicle odometers to charge drivers based on the number of miles they travel rather than the amount of gasoline consumed. VMT fees may also improve the transportation system’s performance.

A 2007 study of the Washington D.C. metro area found that a VMT charge would also encourage many people to move to more central locations9—lowering congestion levels and increasing the use of public transit and non-vehicle travel options.10 Overall, the study’s model showed that a 10-cent-per-mile VMT charge would improve average weekday car speed inside the Washington Beltway by 56 percent—and by 80 percent outside the Beltway.11

Benefits

Investing in regional transportation systems achieves widespread, national benefits. Federal support for the Virginia Atlantic Gateway multimodal I-95 corridor congestion relief program is projected to provide nearly $3.5 billion in economic benefits—leveraging federal, state, and private investments more than 3:1—and improve the highway and rail corridors that move over 350 million tons of freight each year and more than 400,000 people a day.12 Strengthening federal support for the Capital Region’s transportation projects will benefit both our local communities and our national economy.

Creating a VMT fee could allow for proactive traffic management, reduced congestion, and increased revenues to support improvements to the Capital Region’s transportation infrastructure. Studies of the District’s metro region indicate that a VMT charge could reduce total vehicle miles traveled by 11 to 14 percent.13

This reduction in total VMT would also achieve reductions in harmful greenhouse gas emissions. One study of the District modeled that a nine-cent-per-mile VMT charge could reduce daily vehicle emissions of volatile organic compounds and carbon monoxide by nearly 18 percent.14

Barriers

Getting Congress to successfully raise the federal gas tax has been a major endeavor for elected officials, transportation agencies, and stakeholders for decades. The next significant opportunity comes in 2020 when federal lawmakers will reauthorize the federal surface transportation programs.15 When Congress was writing the current surface transportation authorization in 2015, transportation advocacy groups demonstrated widespread public support for strengthening the nation’s transportation fund. Yet, despite this, Congress did not address the transportation deficit in a sustainable way and did not raise transportation revenues. Instead, Congress transferred over $75 billion16 from the nation’s general fund meant to support other government programs to pay for a slight increase in transportation funding over five years.

In Oregon’s pilot of a VMT fee, the general public initially expressed privacy concerns—given the use of technology to gather travel data used to implement VMT fees.17 After the pilot, survey results showed that 83 percent found road usage charges to be “a lot more fair” or “somewhat more fair” than gas taxes,18 and 91 percent of pilot participants supported expanding the VMT fee statewide.19

Next moves

With a growing transportation funding gap, the region needs a reinvigorated federal partner, and should increase the rate of return from federal transportation grants, including leveraging federal grants to advance alternative sources of transportation funding.

Next moves are:

  • The U.S. Congress should increase revenues raised for transportation investments, starting with a significant increase in user-fees, such as the federal gas tax
  • Maryland Department of Transportation (MDOT), District Department of Transportation (DDOT), Virginia Department of Transportation (VDOT), and the region’s MPOs should coordinate regional applications for competitive federal transportation grants to increase the region’s success rate
  • MDOT, DDOT, and VDOT should jointly seek federal funding to deploy a Capital Region VMT fee pilot

Costs

For our region to remain globally competitive, it must invest in the region’s transportation system at all levels of government. Raising transportation revenues at the federal level will increase costs for consumers in the Capital Region. The Capital Region’s transportation agencies must work together to advocate for an increase to federal transportation revenues, but also work together to maximize the region’s return on their investment by securing more competitive grant funds. These grants come with varying levels of state or local match (20 to 50 percent or more), but the federal funds can be the difference between a project advancing or sitting on the shelf for years, if not decades.

Citations:

  1. “More Stop-and-Go Financing of Highway Trust Fund.” Peter G. Peterson Foundation, May 2015. https://www.pgpf.org/budget-basics/more-stop-and-go-financing-of-highway-trust-fund
  2. The amount of direct federal transportation funds that states and urban regions receive each year is based on a set formula.
  3. D.C. replaced its gas tax with an 8 percent wholesale fuel tax. Maryland indexed its gas tax to inflation, added a 5 percent wholesale fuel sales tax, and indexed Maryland Transit Administration (MTA) transit fares to inflation. Virginia replaced its gas tax with a 5.1 percent wholesale fuel sales tax, redirected some existing sales tax and a new sales tax to transportation, and created regional transportation funds for NOVA and Hampton Roads by increasing sales tax in those regions by 0.7 percent.
  4. Partnership analysis of the 2040 long-range transportation plans for the BRTB, TPB, FAMPO and RRTPO.
  5. Partnership analysis of Federal Highway Administration Traffic Volume Trends and Motor Fuel and Highway Trust Fund, and U.S. Energy and Information Administration Annual Energy Outlook and U.S. Total Gasoline Wholesale/Resale Price by Refiners.
  6. “More Stop-and-Go Financing of Highway Trust Fund.” Peter G. Peterson Foundation, May 2015. https://www.pgpf.org/budget-basics/more-stop-and-go-financing-of-highway-trust-fund
  7. Partnership analysis of authorization provided under the Fixing America’s Surface Transportation Act of 2015 and Federal appropriations provided in Fiscal Years 2017 and 2018.
  8. In 2015, local communities submitted 627 applications requesting more than $10.1 billion in federal funding support through the BUILD grant program, which was 20 times the amount available for disbursement. “U.S. Department of Transportation Announces $20 Million in TIGER Funds to Develop Birmingham Bus Rapid Transit System.” Federal Transit Administration, October 30, 2015. https://www.transit.dot.gov/about/news/us-department-transportation-announces-20-million-tiger-funds-develop-birmingham-bus; “Annual MPO Meeting SMART SCALE Update.” Office of the Secretary of Transportation, Commonwealth of Virginia, February 1, 2017. http://www.virginiadot.org/projects/resources/SYIP/2016/fall/SMART_SCALE_Upate.pdf.
  9. The model used in the study found that almost 11,000 people would move inside the Beltway. The increase would be particularly concentrated in the District and Arlington County.
  10. Safirova, Elena, Sébastien Houde, and Winston Harrington. Discussion Paper: Spatial Development and Energy Consumption. Resources for the Future, December 2007. http://www.rff.org/files/sharepoint/WorkImages/Download/RFF-DP-07-51.pdf
  11. Ibid.
  12. Atlantic Gateway: Partnering to Unlock the I-95 Corridor. VDOT and DRPT FASTLANE Grant Application prepared for USDOT, April 14, 2016. http://www.virginiadot.org/projects/resources/atlantic_gateway/Atlantic_Gateway_FASTLANEGrantApp2016.pdf.
  13. A study by Resources for the Future (RFF) models a 14.5 percent decrease in daily VMT. A Brookings paper mentions another RFF study estimated a decrease of 19.4 million vehicle miles traveled—a reduction of more than 11 percent. Safirova, Elena, Sébastien Houde, and Winston Harrington. Discussion Paper: Spatial Development and Energy Consumption. Resources for the Future, December 2007. http://www.rff.org/files/sharepoint/WorkImages/Download/RFF-DP-07-51.pdf; Road-use Pricing: How Would You Like to Spend Less Time in Traffic? Brookings Metropolitan Policy Program, June 2009. https://www.brookings.edu/wp-content/uploads/2012/04/0625_transportation_rivlin.pdf.
  14. Safirova, Elena, Sébastien Houde, and Winston Harrington. Discussion Paper: Marginal Social Cost Pricing on a Transportation Network. Resources for the Future, December 2007. http://www.rff.org/files/sharepoint/WorkImages/Download/RFF-DP-07-52.pdf
  15. The Fixing America’s Surface Transportation Act of 2015 (HR 22) authorizes the federal surface transportation program for five years.
  16. Specifically $75.4 billion. “Summary of House-Senate Federal Transportation Authorization (FAST Act) Conference Report as Introduced on December 1, 2015.” Transportation for America, December 2015.
  17. Road Usage Charge Pilot Program Preliminary Findings. Oregon Department of Transportation Office of Innovative Partnerships & Alternative Funding, February 2013. http://library.state.or.us/repository/2013/201302251521561/
  18. Ibid.
  19. Road-use Pricing: How Would You Like to Spend Less Time in Traffic? Brookings Metropolitan Policy Program, June 2009. https://www.brookings.edu/wp-content/uploads/2012/04/0625_transportation_rivlin.pdf
Expand to learn more Collapse

Contact Us

Phone Number

General Inquiries

202 765 2024

Email Address

[email protected] [email protected]
Sign Up For Updates