Solution 2.0

02. Improve Roadway and Trail Performance

Annual Congestion Cost (Per Driver)

Baltimore $1,115
Washington $1,834
Richmond $729

Source: 2015 Urban Mobility Scorecard, Texas A&M Transportation Institute

While roadway congestion is a sign of robust economic activity, excessive congestion inhibits our economic performance by limiting the ability of consumers to access jobs, arrive on time for work and meetings, and efficiently access necessary services like education and healthcare. Many parts of the region suffer from excessive congestion today. Congestion is most acute in the Washington and Baltimore metro areas, as well as along the I-95 corridor connecting Richmond to the District. On average, congestion costs each Baltimore metro resident $1,100 annually and each Washington metro area resident $1,834 annually—the highest amount for any metro area in the nation.1 Without regional action, projections show congestion will worsen by 2040—growing by more than 150 percent throughout the Capital Region—eventually consuming 50 percent of the time spent in a vehicle.

Addressing Roadway Congestion

Possible Solutions

Build Highway
Additional Capacity
  • Requires infrastructure investment and land
  • Free lane access induces more trips that can negate most benefits from new capacity
  • LA spent $1.6 billion over six years to widen the I-405 that resulted in average rush hour travel
Manage roadway demand by tolling new/untolled roads or implementing decongestion pricing zones
  • Toll revenue pays for capital and maintenance investments for the facility
  • Improves travel time, reliability, and decreases congestion
  • Increase person throughput
  • Can generate revenue to invest in public transportation
Develop transit
network and service
  • Requires infrastructure investment and land on the type of transit (i.e. bus versus rail)
  • Investment in transit alone provides minimal decrease in roadway congestion

With rising congestion and limited transportation funds, the Capital Region should maximize the performance of existing transportation infrastructure by expanding and coordinating a performance-driven toll network, making necessary investments to relieve chokepoints, and ensuring that scarce transportation dollars provide broad benefits that improve the entire transportation system, including safe travel options for bicyclists and pedestrians.

Capital Region Performance

What if a seamless performance-driven toll network on our highways gave you the option to pay to speed up your drive to make it to your daughter’s recital, while also ensuring carpools, vans, and buses are always the fastest movers on the road? Performance-driven tolling is a tool that, when deployed correctly, can reduce congestion, increase speeds, and improve reliability by allocating a fee to single-occupant vehicles. This creates incentives for consumers to divert trips to non-peak periods, increase the number of vehicle occupants to travel free of charge, or opt for public transportation and carpooling.

The Capital Region is at the national forefront of using performance-driven tolling to combat roadway congestion and improve mobility and access. In total, Maryland and Virginia have 35 toll facilities operating, under construction, or in planning stages (13 in Maryland and 22 in Virginia).2 However, not all the Capital Region’s toll facilities deliver performance-driven outcomes, and the region currently lacks the strong intra-regional coordination necessary to maximize the potential benefits of this innovative mobility solution. For example, Maryland plans to create toll facilities on I-495, I-270, and the Baltimore-Washington Parkway, and connect these toll lanes with Virginia’s I-495 express lanes, but there is no requirement for the two toll networks to seamlessly integrate.

Plans to connect Virginia’s and Maryland’s toll systems will also require coordination and agreement to make critical investments to rebuild and expand the American Legion Bridge. Commuters on the northbound Inner Loop of I-495 face daily backups where express lane users exit those lanes on the Virginia side of the American Legion Bridge before passing into Maryland, which does not provide an express option. This section of road is the Washington metro area’s worst bottleneck, with peak period congestion increasing by 30 percent from 2015 to 2017.3 Addressing this and other key roadway chokepoints in the Capital Region is critical for improving the performance of our transportation network.

By coordinating tolling among the states in the Capital Region, we can ensure that toll facilities give drivers the reliable travel at higher speeds they need when their time is limited. As new tolling charges are considered and implemented, and as existing tolls evolve and connect, coordination among Maryland, Virginia, and the District will be key for reducing congestion and improving our regional transportation system. If done correctly, expanding and connecting the Capital Region’s toll network using performance-based tolling could produce significant congestion benefits, with estimates suggesting peak period delay could be reduced by 11 percent.4 Analysis conducted in 2017 by the National Capital Region Transportation Planning Board’s (TPB) Long-Range Plan Task Force found that a toll network would directly address several of the Washington metro area’s most significant roadway bottlenecks, including a new American Legion Bridge.5 Charging drivers a toll to enter congested central business districts is another cost-effective way to reduce congestion and raise revenues that can improve the performance of the entire transportation system. London, Stockholm, and Singapore have implemented decongestion pricing programs—resulting in 20-30 percent congestion reduction.6

The Capital Region benefits from hundreds of miles of multi-use trails, and investments in a few critical trail connections for bicyclists—and infrastructure for pedestrians—can achieve further reductions in congestion, increase economic development, and improve community health outcomes. The Baltimore and Washington metro areas have clear strategies to close gaps between existing trails, and the Richmond metro area should develop such a strategy. If executed well, the region has the potential to generate economic benefits as high as an eight-to-one return on investment as seen in other U.S. regions and reduce rates of chronic diseases, which in turn, reduces direct health treatment costs in the community.7

Actions

Citations:

  1. “Baltimore Greenway Trails Coalition.” Rails-To-Trails Conservancy. https://www.railstotrails.org/our-work/trailnation/baltimore-greenway-trails-coalition/
  2. Ibid.
  3. “Trail Projects.” Capital Trails Coalition. http://capitaltrailscoalition.org/trail-projects/
  4. “Item 11-Information: Non-Motorized Priority Projects.” TPB Technical Committee Meeting Materials. MWCOG, January 2018. https://www.mwcog.org/assets/1/28/01052018_-_Item_5_-_Non-Motorized_Priority_Initiatives.pdf
  5. Capital Trails Coalition email exchange with the Partnership.
  6. Plan 2040. Richmond Regional Transportation Planning Organization. Amended March 2017. http://www.richmondregional.org/plan2040/plan2040_MTP.pdf
  7. Richmond Region Bicycle Infrastructure Report. BikeWalk RVA. February 2016. https://www.sportsbackers.org/wp-content/uploads/2016/03/BaselineReport_2016_online.pdf
  8. “The Atlanta Beltline in 5.” Atlanta Beltline. https://beltline.org/about/the-atlanta-beltline-project/atlanta-beltline-overview/
  9. “We Are on the Trail to a New Future for Atlanta.” Atlanta Beltline. https://beltline.org/progress/planning/trail-planning/
  10. “A Catalyst for Economic Growth and Renewal.” The Atlanta Beltline. https://beltline.org/progress/progress/economic-development-real-estate/
  11. “Trail Facts.” Indianapolis Cultural Trail. https://indyculturaltrail.org/alongthetrail/facts-and-figures/
  12. Ibid.
  13. Ibid.
  14. “Case Study: Nashville, TN.” Transportation for America and the APHA. http://t4america.org/wp-content/uploads/2016/09/Nashville-Case-Study.pdf
  15. Ibid.
Expand to learn moreCollapse

Action 2.1

Expand and Coordinate the Region’s Highway Performance-Driven Toll Lane Network

What

Roadway congestion places a significant burden on many of our 10.2 million residents and their employers. Convincing just a small number of residents to shift travel from driving alone to alternative trip options can reduce congestion, which translates into improved speed and reliability.

Performance-driven tolling is a tool that allocates a fee to single-occupant vehicles for the use of certain roadways at specified times. When deployed correctly and combined with other strategies meant to reduce single-occupancy vehicle use, performance-driven tolling creates incentives for consumers to divert trips to non-peak periods, increase the number of vehicle occupants, or opt for public transportation and carpooling. As a result, congestion on those roadways is reduced, speeds are increased, transit use may rise, and reliability improves. Additionally, investing the revenues raised back into the transportation system can provide consumers with improved travel options across the board. Performance-driven tolling can also more equitably levy the costs for the road’s maintenance and capacity expansion.

Principles for Performance-Driven Tolling in the Capital Region

  1. Tolling investments should improve the transportation system, not just the tolled facility
  2. Toll planning should be coordinated regionally to deliver the benefits of greater mobility and reliability to all consumers of the transportation system
  3. Decision-makers should prioritize providing the greatest number of people access to economic opportunity, not moving the most vehicles or generating the most revenue
  4. Consumers of all income levels should benefit from the tolling investment, including those without the financial means to afford the tolls
  5. Tolling revenues should be invested in cost-effective public transportation enhancements
  6. Public agencies should conduct robust and broad public engagement to develop goals, performance metrics and public benefit assessments for each tolling project, whether delivered by the public agency or by a public-private partnership

Why

The Capital Region is at the national forefront of using performance-driven tolling to combat roadway congestion and improve mobility and access. In total, Maryland and Virginia have 35 toll facilities operating, under construction, or in planning stages (13 in Maryland and 22 in Virginia).1 However, not all the Capital Region’s toll facilities deliver performance-driven outcomes, which creates an inconsistent patchwork of tolled facilities oriented around different and sometimes uncoordinated goals. This patchwork structure limits the potential benefits to the consumers—and, in certain areas, persistent congestion results where toll systems start and end.

Maryland is considering a new tolling network in the Washington metro area with connections to the Baltimore metro area and Virginia’s existing system at the American Legion Bridge and the Woodrow Wilson Memorial Bridge.2 While valid concerns have been raised about impacts from the project’s design and toll policies, which must be addressed, the proposal creates an opportunity for the Capital Region to deliver a performance-driven tolling network that improves mobility and access for the entire transportation network. This should include a new American Legion Bridge—a critical connection that represents one of the most congested roads in the entire Capital Region3—as the link between Fairfax and Montgomery counties, which host over 35 percent of the region’s jobs and households.4 Revenues from the performance-driven tolls could be used to pay for a new bridge that will allow for rapid transit connectivity between Fairfax and Montgomery counties, which is not an option today.

Capital Region Toll Facilities

It is critical that the region deploy a consistent and coordinated approach for its performance-driven tolling network to deliver fair and equitable benefits, including for those without the financial means to afford the tolls—regardless of where the facility is located. As outlined in Tackling the Capital Region’s Roadway Congestion: Performance-Driven Tolling, six principles should be deployed for all new tolling facilities and, where appropriate, on existing tolling facilities as changes are considered and facilities are increasingly connected. These are important projects that, if delivered correctly, will provide tangible benefits for the region’s transportation system for decades.

Benefits

Analysis conducted by the National Capital Region Transportation Planning Board’s (TPB) Long-Range Plan Task Force in 2017 found that a performance-driven toll network would directly address several of the Washington metropolitan region’s most significant roadway bottlenecks, including the American Legion Bridge.5 Expanding and connecting the toll network using performance-driven tolling would produce the largest congestion benefits of all direct-infrastructure investments outlined in the TPB plan—reducing peak period congestion by 11 percent.6

Virginia also recently opened high-occupancy tolling (HOT) on all I-66 lanes inside the Virginia portion of the I-495 Beltway to the District’s border for morning and evening peak directions. Based on data from the early months of operation, the tolls have delivered increased travel speeds and new predictability for consumers using the highway, while not creating serious congestion on nearby roadways.7 Virginia expects to achieve similar results with its project to convert two existing reversible high-occupancy vehicle (HOV) lanes to HOT lanes for eight miles along I-395 to near the District’s border.

Barriers

The U.S. Congress will need to authorize the sale or lease of the 19-mile section of National Park Service-owned Baltimore-Washington Parkway between MD-175 and the New York Avenue/U.S. Route 50 split at the Prince George’s County/District of Columbia border in order to implement performance-driven tolling on that section. This adds additional complexity because this is not standard practice for the National Park Service or the U.S. Congress. Strong intra-regional collaboration and policy alignment between all government and private stakeholders will be challenging to achieve given decentralized control, with the existence of various tolled facilities in Maryland and Virginia. Despite this challenge, it is necessary to ensure roadway tolling policies are complementary and seamless for consumers regardless of where their trip starts or ends.

Next moves

As new tolling facilities are considered and implemented—and as existing facilities evolve and connect—the coordination and alignment of policies and principles in Maryland, Virginia, and the District will be key for reducing roadway congestion and improving our regional transportation system.

Next moves are:

  • The Capital Region should apply the Partnership’s performance-driven tolling principles to all future toll roads and when modifying existing toll facilities
  • Public agencies should conduct robust and broad public engagement to develop goals, performance metrics, and public benefit assessments for each tolling project—whether delivered by the public agency or a public-private partnership
  • Maryland should establish regionally coordinated performance-driven tolled lanes on I-495 between the American Legion Bridge and Woodrow Wilson Bridge, on I-270 between I-495 and I-70, and apply revenues to replacing the American Legion Bridge and enhancing public transportation options
  • Congress, supported by the Maryland congressional delegation, should direct the National Park Service to lease, to Maryland, the federally-owned segment of the Baltimore-Washington Parkway, with provisions requiring performance-driven tolling on any expanded capacity
  • The Maryland Department of Transportation (MDOT) and the Baltimore Metropolitan Council (BMC) should study the implementation of a performance-driven tolling system on the Baltimore Beltway and I-97

Costs

Maryland estimates the total cost for adding express toll lanes on I-495, I-270, and the Baltimore-Washington Parkway will be $9 billion.8 The money to pay for construction, private financing of the project, and ongoing operations and maintenance is expected to come from fees paid by toll lane users. However, these estimates have not yet been publicly analyzed. For comparison, Virginia’s project to add nearly 23 miles of tolled express lanes along I-66 outside of the Beltway is estimated to cost $3.7 billion and includes the price of interchange improvements, more than 4,000 new park-and-ride spaces, new and improved transit options, and 11 miles of new bike and pedestrian trails.9

Citations:

  1. Partnership analysis of MDOT, DDOT, and VDOT toll facilities.
  2. Announced in September 2017 as part of Maryland’s Traffic Relief Plan. “Traffic Relief Plan.” Annapolis: Maryland Department of Transportation, 2018. http://www.roads.maryland.gov/OC/Traffic-Relief-Plan-FactSheet.pdf
  3. 2018 Congestion Management Process Technical Report. National Capital Regional Transportation Planning Board, 2018.
  4. Partnership analysis of regional housing and job location data.
  5. An Assessment of Regional Initiatives for the National Capital Region: Technical Report on Phase II of the TPB Long-Range Plan Task Force. National Capital Region Transportation Planning Board, December 2017. https://www.mwcog.org/file.aspxD=fyBRBNQUuDN48QEXRc3bNHLp8ytrsSEVcg%2fTMPrzu7g%3d&A=NYyETN4WuxQWWyImU6a2FRzM83OmR9W9kAJRDxObZ6I%3d
  6. Ibid.
  7. Travel times on I-66 averaged nearly 1 minute shorter during morning commutes, and 2.7 minutes shorter during afternoon commutes. Previously, these sections of I-66 were High Occupancy Vehicle (HOV)-only during the new toll periods; and, although they were already experiencing faster travel speeds than adjacent roadways, implementation of HOT still achieved a measurable improvement in speeds and reliability. From the time express lanes opened (in December 2017) until August 2018, there were 14,068 average daily trips eastbound and 16,945 average daily trips westbound. “August 2018 Performance Report: I-66 Express Lanes Inside the Beltway.” Virginia Department of Transportation, August 2018. http://66expresslanes.org/documents/august_2018_performance_report_for_i-66_express_lanes_inside_the_beltway.pdf
  8. “Governor Hogan Announces Widening of I-270, Capital Beltway (I-495), and Baltimore-Washington Parkway (MD 295).” Annapolis: State of Maryland Office of the Governor, September 2017. https://www.roads.maryland.gov/OC/Traffic-Relief-Plan-Press-Release.pdf
  9. “$3.7B I-66 project would transform congested area.” WTOP, November 2017. https://wtop.com/dc-transit/2017/11/ground-broken-66-expansion-outside-beltway/slide/1/ ; “Transforming I-66.” Transform 66. http://outside.transform66.org/default.asp
Expand to learn more Collapse

Action 2.2

Investigate a System to Charge Drivers Entering the Washington Metro Area’s Most Congested Central Business Districts

What

A cost-effective way to reduce roadway congestion, enhance mobility options, and improve the performance of the entire transportation system is to charge drivers a toll to enter congested central business districts. Cities around the world use this form of decongestion pricing—also known as “regional zonal pricing” or “cordon pricing”—to reduce congestion. Typically, the congestion fee is charged during weekdays and is waived or discounted for specific groups of transportation users (e.g., emergency vehicles, buses, electric vehicles, non-commercial vehicles registered to disabled persons, etc.).

In the Capital Region, severe and unpredictable congestion occurs during most of the day in the District’s central business district and portions of Arlington County, including the Pentagon, Rosslyn, Pentagon City, and Crystal City. The Capital Region could improve congestion management in these activity centers by instituting decongestion pricing programs. The region should investigate the potential benefits of implementing a decongestion pricing program for the District and Arlington.

Why

The Capital Region is one of the most congested regions in the United States1, with severe congestion occurring in the core business districts of the District and Arlington. Decongestion pricing has proven successful at reducing congestion in cities around the world. Milan, Italy, has reduced central Milan’s vehicle congestion by approximately 33 percent as a result of its weekday decongestion pricing program2. Likewise, London saw a 30 percent reduction in congestion; Stockholm saw inner-city traffic decline by 20 percent; and Singapore’s dynamic decongestion pricing system has achieved a 24 percent drop in traffic3. Studies predict decongestion pricing would achieve significant results in U.S. cities, as well—New York City could see a 13 percent reduction in weekday commuter traffic into central Manhattan4 and the Capital Region could see 17,000 daily trips into the District shift to transit5.

In a 2015 study of various transportation strategies for the District, Washington Metropolitan Area Transit Authority (WMATA) included a $5 charge for vehicles entering the District’s central business district and portions of Arlington County6. The study found this decongestion price—combined with removing free parking—would result in an increase in transit ridership of 30 percent over 2040 projections7. By studying decongestion pricing comprehensively as a region, we can better understand both the potential benefits and how it could be deployed as part of a coordinated, larger transportation strategy.

Establishing a decongestion pricing program for the region’s most congested central business districts could significantly enhance our entire transportation system as well as improve travel speeds and the reliability of roadways within the charged zone. Regional decongestion pricing zones establish annual sources of revenue that have generated more than $100 million in other regions throughout the globe. By using these funds to invest in transit and transportation infrastructure—such as new buses, park-and-ride spaces, and bicycle infrastructure—cities can achieve widespread benefits throughout their transportation systems.

New HOV4+ Lanes Were Established

London
Decongestion Charge The cordon pricing scheme uses automatic number plate recognition in an 8-square-mile area (21-square-kilometer zone). Vehicles are registered automatically by cameras that photograph the plate number. The system consists of overhead gantries, cameras at all entrance points, pavement markings, and street signage.
Results – Transportation System Improvements
  • 300 new buses
  • Updated bus routes
  • Expanded bus service
  • 8,500 park-and-price spaces
  • Expanded bike and pedestrian infrastructure
Results – Congestion, Traffic Flows Compared to pre-congestion pricing congestion levels, in 2004 Transport for London reported a 30 percent reduction in traffic congestion, a 30 percent increase in average speed, and significant increases in travel time reliability. Traffic entering the zone during charging hours has declined by 18 percent, and traffic circulation within the zone has declined by 15 percent. Bus service increased by 23 percent, and reliability and journey time improved as well. As a result, bus rideship has increased by 38 percent.
Annual Net Revenue 137 million pounds/year (USD $182 million)
Stockholm
Decongestion Charge The cordon congestion tax scheme uses an automatic number plate recognition in a 13-square-mile area (35-square-kilometer zone). Vehicles are registered automatically by cameras that photograph the number plates. The system consists of overhead gantries, camera at all entrance points, pavement markings, and street signage. The scheme was launched in 2007 after a successful trial in 2006. Taxis and for-hire vehicles, such as Uber, also oagy the tax.
Results – Transportation System Improvements
  • 197 new buses
  • 16 new bus routes
  • 2,800 new regional park-and-ride spaces
  • Expanded bike and pedestrian infrastructure
Results – Congestion, Traffic Flows Traffic to and from inner-city cordon was reduced by 20 percent, and traffic delays decreased by 30-50 percent. Vehicle miles traveled decreased by 14 percent in the cordon and decreased by 1 percent outside the cordon. After the variable pricing system was introduced in 2016, traffic congestion dropped an additional 5 percent during that period.
Annual Net Revenue 1.3 billion krona/year (USD $155 million)
Singapore
Decongestion Charge The electronic road pricing (ERP) scheme is fully automatic on specific routes, times of day, and directions, with variable pricing designed to respond to congestion in real time. Vehicles are required to have an in-vehicle unit on the dashboard and a smart card with the fare stored on it. Overhead gantries detest the type of vehicle and the congestion on the route at specific times, and deduct the variable fee from the smart card. the ERP scheme was launched in 1998, replacing a cordon pricing scheme that was first implemented in 1975.
Results – Transportation System Improvements
  • 197 new buses
  • 16 new bus routes
  • 2,800 new regional park-and-ride spaces
  • Expanded bike and pedestrian infrastructure
Results – Congestion, Traffic Flows Traffic to and from inner-city cordon was reduced by 20 percent, and traffic delays decreased by 30-50 percent. Vehicle miles traveled decreased by 14 percent in the cordon and decreased by 1 percent outside the cordon. After the variable pricing system was introduced in 2016, traffic congestion dropped an additional 5 percent during that period.
Annual Net Revenue 1.3 billion krona/year (USD $155 million)

Source: A Way Forward For New York City - 2017 (PDF)

Benefits

In its moveDC long-range transportation plan, the District included a $10 decongestion charge for drive-alone vehicles that enter the downtown business district. This decongestion pricing would have generated approximately $330 million in annual revenue and would have encouraged 17,000 vehicle trips to shift to transit.8

Decongestion pricing programs in other cities have sustained congestion reductions over time. In 2015, London had nearly 10 percent less traffic volume compared with 2000, despite a nearly 20 percent growth in the city’s population during that time.9 By reinvesting all revenues into the transportation system, London’s decongestion pricing program also delivered 300 new buses and corresponding service, established 8,500 park-and-ride spaces, and added significant bicycle infrastructure.

Using the Partnership’s performance-driven tolling principles, decongestion pricing can deliver results for all users of our transportation system. It is important that any scheme take into account where lower-income residents live and work—and how best to mitigate impacts from the charge and improve mobility options for these residents. For example, a proposed decongestion charge for New York City showed it could improve mobility options and enhance transit service for low-income residents on a nearly 40:1 basis when compared to those that would likely be assessed a fee to enter the decongestion zone.10

Reducing congestion using decongestion pricing also achieves larger environmental and health benefits. Since establishing its decongestion pricing program, Singapore has decreased levels of CO2 and other greenhouse gas emissions by 10-15 percent within the inner city. After implementing decongestion pricing, Stockholm reduced CO2 by 14 percent in the inner city and reduced greenhouse gas emissions by approximately 2.5 percent outside the charged zone. Air pollution modelling estimates that, as a result, Stockholm will have 25-30 fewer premature deaths per year in the city’s metropolitan area.11

Barriers

While decongestion pricing has been studied in some U.S. cities, it has never been implemented. The Capital Region could lead the country and bring best practices of decongestion pricing from cities around the world to the United States.

To be most effective, the Capital Region’s decongestion pricing program must span political boundaries—particularly those of the District and Virginia. It should also be clear about how this approach would be applied to lower-income residents. This will require significant coordination of the region’s jurisdictions, including a clear articulation of how the entire region would benefit from a decongestion strategy.

Next moves

In many areas of the region, roads cannot be expanded—particularly in central business districts. Reliable and rapid access to and from these thriving areas of the region is essential to the region’s economic health and prosperity. Decongestion pricing is a proven tool to reduce congestion in these areas, enhance non-driving transportation options for the entire region, and reduce negative health impacts from the transportation system. A strategy should be pursued to investigate if decongestion pricing is a viable tool for the Washington metro area to implement.

Next moves are:

  • District Department of Transportation (DDOT) and Arlington County—in consultation with Metropolitan Washington Council of Governments (MWCOG)—should study and make recommendations on the feasibility of decongestion pricing zones in the Washington metro area
  • DDOT and Arlington County should provide a report and recommendations to Maryland Department of Transportation (MDOT), Virginia Department of Transportation (VDOT), and MWCOG within 12 months that addresses the following issues:
    • Whether it is feasible for the region to establish a multi-jurisdiction decongestion zone;
    • Identification of transportation investments to improve non-vehicle access into, out of, and within a multi-jurisdiction decongestion zone;
    • Recommendations for dynamic fee structures to measurably reduce congestion from single-occupant vehicles, taxis, delivery trucks, and transportation network companies (TNCs) accessing the decongestion priced zone(s);
    • What approaches could be used to minimize impacts on low-income residents;
    • Whether a new regional entity should be created or existing entities should be given new responsibilities;
    • Recommendations for performance measures to assess a decongestion pricing mechanism; and
    • Additional steps the Washington metropolitan area can take to coordinate congestion reduction strategies in its congested business districts

Costs

The Seattle Department of Transportation is spending $200,000 to study decongestion pricing for its downtown area.12 The cost for conducting a regional study in the Capital Region could be similar.

As evidenced in other cities, the up-front costs to establish a zonal pricing area are recouped through the revenues generated. Over time, cities have also found ways to reduce operating expenses.

Stockholm’s zonal pricing area required an initial investment of approximately $236.7 million—all of which was recouped after four years. In the first 10 years of operation, the city decreased operating costs by nearly 40 percent and was supported by the public to increase congestion prices, in part by moving to a dynamic pricing system in 2016. Annual net revenues from the inner-city congestion program are approximately $155 million and directly support improvements to the transportation system.13

Citations:

  1. “Traffic Relief Plan.” Annapolis: Maryland Department of Transportation, 2018. http://www.roads.maryland.gov/OC/Traffic-Relief-Plan-FactSheet.pdf
  2. “Appendix X: Cordon Charge Research and Analysis.” District Department of Transportation Multimodal Long-Range Transportation Plan. moveDC, March 2014.
  3. Road Pricing in London, Stockholm and Singapore: A Way Forward for New York City. Tri-State Transportation Campaigns 2018. http://www.tstc.org/reports/A-WAY-FORWARD-FOR-NEW-YORK-CITY-2017.pdf
  4. “Fix NYC Advisory Panel Report.” Fix NYC Advisory Panel with HNTB, January 2018. http://www.hntb.com/HNTB/media/HNTBMediaLibrary/Home/Fix-NYC-Panel-Report.pdf
  5. “Appendix X: Cordon Charge Research and Analysis.” District Department of Transportation Multimodal Long-Range Transportation Plan. moveDC, March 2014.
  6. “ConnectGreaterWashington—Land Use Alternatives: Summary of Scenario B.” WMATA, March 2016. https://planitmetro.com/wp-content/uploads/2016/03/Scenario-B-Summary-for-Plan-It.pdf
  7. Ibid.
  8. The analysis assumes the congestion charge is in operation for an approximate 250 business days per year and an exemption rate of approximately 40 percent to account for uncharged vehicles—leaving approximately 220,000 subject to the weekday congestion charge. “Appendix X: Cordon Charge Research and Analysis.” District Department of Transportation Multimodal Long-Range Transportation Plan. moveDC, March 2014.
  9. Road Pricing in London, Stockholm and Singapore: A Way Forward for New York City. Tri-State Transportation Campaign, 2018. http://www.tstc.org/reports/A-WAY-FORWARD-FOR-NEW-YORK-CITY-2017.pdf
  10. Ibid.
  11. Ibid.
  12. “Tolls on downtown streets? Seattle mayor pushes for plan to cut traffic, greenhouse gases.” The Seattle Times, April 2018. https://www.seattletimes.com/seattle-news/transportation/seattle-mayor-wants-a-tolling-plan-to-reduce-traffic-congestion-greenhouse-gases/
  13. All dollar amounts are in USD. Road Pricing in London, Stockholm and Singapore: A Way Forward for New York City. Tri-State Transportation Campaign. 2018. http://www.tstc.org/reports/A-WAY-FORWARD-FOR-NEW-YORK-CITY-2017.pdf
Expand to learn more Collapse

Action 2.3

Complete the Baltimore Greenway Trails Network and Capital Trails Network, and Establish a Richmond Trail Network Strategy

What

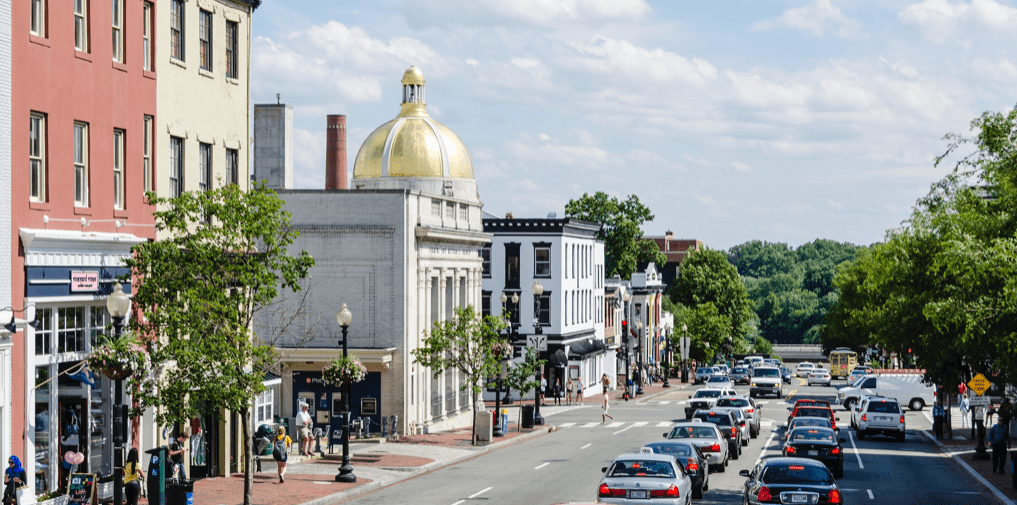
Connected trail systems can lessen demand on the roadway network, improve connections to jobs and activity centers, increase regional economic activity, contribute to healthy communities, and enhance access to the outdoors and our iconic parks and landscapes in both rural and urban areas. Maryland, the District, and Virginia have more than 1,000 multi-use trail miles, with major nationally-recognized trails such as the East Coast Greenway, the C&O Canal Towpath, the Anacostia Tributary Trails, the Capital Crescent Trail, the Mount Vernon Trail, the W&OD Trail, and the Virginia Capital Trail.

Yet, despite considerable investments, the region’s trails do not form coherent and connected regional networks in the Baltimore, Washington, and Richmond metro areas. In many instances, the trails also do not provide seamless connections to non-trail bicycle and pedestrian networks. Federal, state, and local governments should collaborate with trails groups and private entities to speed up the delivery of the Baltimore Greenway and the Capital Trails Network, and establish a trail connecting activity centers from Ashland to Richmond to Petersburg with the 52-mile Virginia Capital Trail.

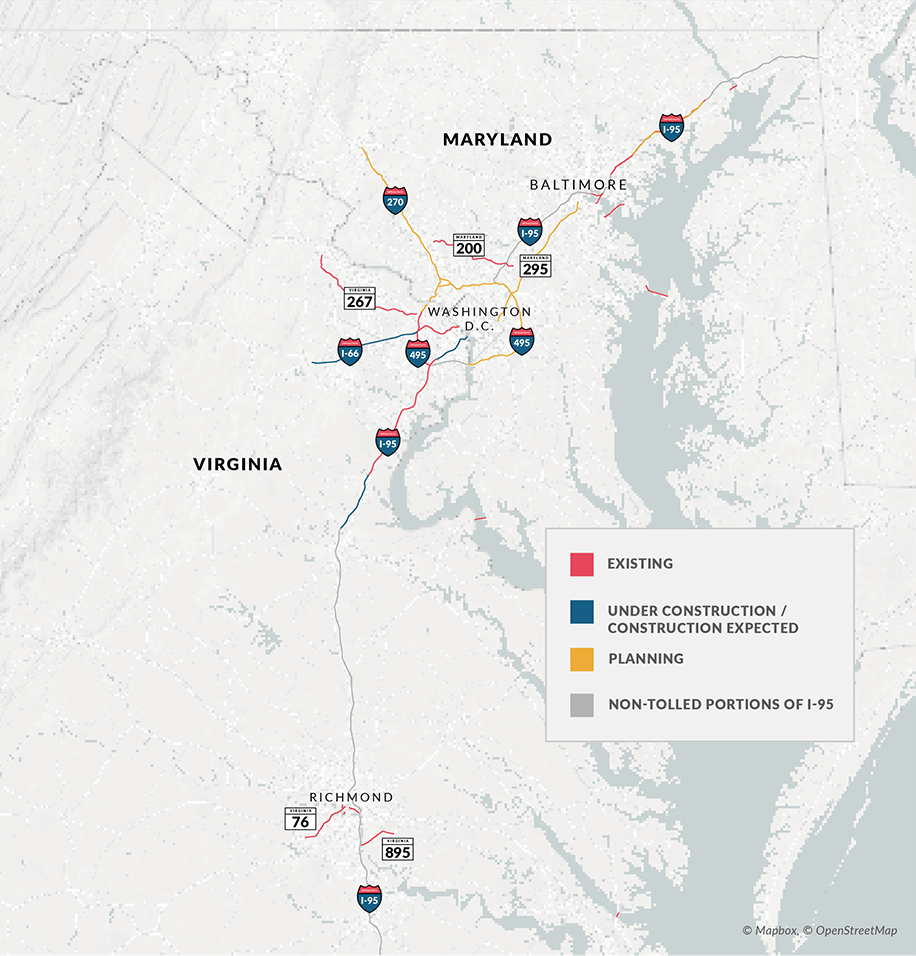
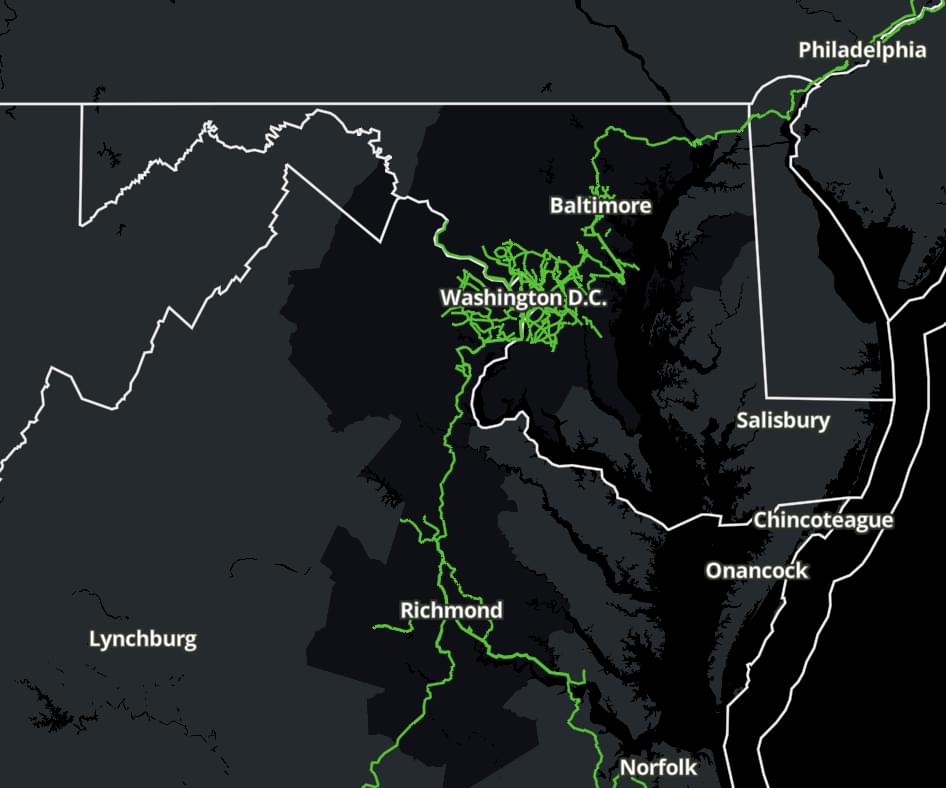
Capital Region Trails

Why

Many commute trips are less than five miles, a distance most can bike. In addition, many non-commuting trips can be completed efficiently by biking or walking if safe options exist. Trail connections to essential destinations such as jobs and transit stops can lower demand on the region’s roadway network, which reduces congestion.

However, the lack of trail connectivity diminishes the region’s ability to conveniently overcome man-made barriers, such as roads, to access jobs, schools, and outdoor opportunities. This lack of trail connectivity encourages consumers to drive rather than complete trips by bike or foot, limits greenspace for recreation, and isolates communities.

The Capital Region already benefits from clusters of locally and regionally connected trails in some areas. A few critical investments would create a network of trails—creating a sum far greater than its parts.

Baltimore City has more than 25 miles of existing trails. However, 10 miles of new trail in four key corridor gaps will connect the 35-mile Baltimore Greenway Trails network.1 The planned network will better connect more than 60 diverse neighborhoods—many of which are isolated from upward social and economic mobility opportunities due to limited transportation connections, whether by vehicle, transit, bike, or walking.2 This network will also connect residents to major transit hubs, employment centers, anchor institutions, cultural amenities, and recreational opportunities by connecting park space, residential neighborhoods, and the downtown core. This investment in active transportation connectivity should then be connected to existing and planned regional trail assets to better connect the metro area—including the BWI Airport Loop Trail, the Baltimore & Annapolis Trail, the Torrey C. Brown Trail, and the Patapsco Regional Greenway.

With 436 miles of trails in the Washington metro area, the proposed Capital Trails Network would add more than 300 miles of trails, including a connected 45-mile circumferential trail.3 If completed as proposed, millions of residents would live within two miles of a trail, connecting households to jobs, metro stations and regional activity centers.4 The Capital Trails Coalition has identified the 40 most critical trail projects to advance the network.5

The Richmond metro area has two of the oldest national bike routes (U.S. Bike Route 1 and 76) passing through,6 and more than 40 miles of paved trails.7 The Virginia Capital Trail, completed in 2015, connects Richmond to Jamestown, the former capital.

Benefits

Investing in trail networks can change the way the Capital Region’s consumers work, live, and play—in ways similar to the Atlanta BeltLine Trail or the Indianapolis Cultural Trail. The BeltLine plans for 33 miles of multi-use trail (which includes a 22-mile circumferential loop with transit) and will provide bike and walk connections between neighborhoods previously cut off by highway and rail lines.8 As of September 2018, 11 miles of trail are open to the public, including completed permanent segments and temporary interim trails.9 The investment strategy has generated great economic benefit—an 8:1 return on investment, with over $4 billion in private development occurring over the past 10 years, including growth of development during the Great Recession. The investment that has occurred in the Atlanta BeltLine Planning Area is a development benefit for not only the City of Atlanta, but the entire metro region.10

In 2013, Indianapolis completed its eight-mile Cultural Trail, which connects to 40 miles of the existing trail system and six cultural districts spread across the city.11 To complete the $63 million project, Indianapolis leveraged $35.5 million in federal transportation funding and $27.5 million in private funding.12 As a result, the trail has generated an estimated $864.5 million in economic benefits—more than a 13:1 return on investment.13

Active transportation options have also been linked to improving community health outcomes. Research and data modelling conducted by the Center for Disease Control and Prevention and the Nashville metropolitan planning organization (MPO) found that 13 minutes a day of active transportation could reduce rates of 12 chronic diseases.14 By increasing how frequently the average Middle Tennessee resident chose to bike or walk, the Nashville region could save $116 million annually due to reduced direct health treatment costs and gains in productivity.15

Barriers

Each trail corridor is different and offers different challenges. To increase trail usage, barriers to safe and efficient access to the trail entry points by walking, biking, or using transit should be removed. Common barriers faced by other trail projects in the country include competing uses, access to private lands, issues of liability, privacy concerns, local opposition, and funding for planning, construction, and maintenance of the system.

Next moves

The projected benefits from completion of the Baltimore Greenway Trails Network and Capital Trails Network are expected to far exceed costs. Realization of the benefits will not occur until all links of the trail network are connected for these projects, which will require visionary civic leaders; committed elected officials at the federal, state, and local levels; and leadership from private business to deliver success in the near term.

Next moves are:

  • Baltimore City, the Baltimore Metropolitan Council (BMC), the Baltimore Greenway Trail Coalition, and the philanthropic community should work with private landowners and neighborhoods to identify timelines and funding sources to complete the Greenway within five years
  • The National Park Service, Metropolitan Washington Council of Governments (MWCOG), local jurisdictions, and the Capital Trails Coalition should include the Capital Trails Network in the region’s long-range transportation plan and seek funding for priority trail connection projects in annual regional and federal funding grant cycles
  • Virginia Department of Transportation (VDOT), Richmond Regional Transportation Planning Organization (RRTPO), and local governments should study and identify a preferred trail route connecting the Virginia Capital Trail in downtown Richmond to points as far north as Ashland with points as far south as Petersburg

Costs

Building regional trail networks requires funding and financing for planning, design, construction, and maintenance. However, building a trail generally costs far less than constructing a mile of additional road lanes. Local and regional governments should prioritize investments in trail networks in their capital programs.

Citations:

  1. “Baltimore Greenway Trails Coalition.” Rails-To-Trails Conservancy. https://www.railstotrails.org/our-work/trailnation/baltimore-greenway-trails-coalition/
  2. Ibid.
  3. “Trail Projects.” Capital Trails Coalition. http://capitaltrailscoalition.org/trail-projects/
  4. “Item 11-Information: Non-Motorized Priority Projects.” TPB Technical Committee Meeting Materials. MWCOG, January 2018. https://www.mwcog.org/assets/1/28/01052018_-_Item_5_-_Non-Motorized_Priority_Initiatives.pdf
  5. Capital Trails Coalition email exchange with the Partnership.
  6. Plan 2040. Richmond Regional Transportation Planning Organization. Amended March 2017. http://www.richmondregional.org/plan2040/plan2040_MTP.pdf
  7. Richmond Region Bicycle Infrastructure Report. BikeWalk RVA. February 2016. https://www.sportsbackers.org/wp-content/uploads/2016/03/BaselineReport_2016_online.pdf
  8. “The Atlanta Beltline in 5.” Atlanta Beltline. https://beltline.org/about/the-atlanta-beltline-project/atlanta-beltline-overview/
  9. “We Are on the Trail to a New Future for Atlanta.” Atlanta Beltline. https://beltline.org/progress/planning/trail-planning/
  10. “A Catalyst for Economic Growth and Renewal.” The Atlanta Beltline. https://beltline.org/progress/progress/economic-development-real-estate/
  11. “Trail Facts.” Indianapolis Cultural Trail. https://indyculturaltrail.org/alongthetrail/facts-and-figures/
  12. Ibid.
  13. Ibid.
  14. “Case Study: Nashville, TN.” Transportation for America and the APHA. http://t4america.org/wp-content/uploads/2016/09/Nashville-Case-Study.pdf
  15. Ibid.
Expand to learn more Collapse

Contact Us

Phone Number

General Inquiries

202 765 2024

Email Address

[email protected] [email protected]
Sign Up For Updates